Greenhouse Predicts
Background
One of the biggest challenges that recruiting teams, hiring managers, and CFOs face is the ability to accurately forecast new hire start dates. Since recruiters don’t have a strong sense for when a job will close, they often rely on gut feel which can lead to missing hiring deadlines and miscommunication with stakeholders. This causes uncertainty for finance teams trying to plan headcount budgets, hiring managers trying to plan their team’s work, and recruiters trying to plan their time.
Some of the other problems to keep in mind were: the hierarchy of the job dashboard didn't quite reflect the priorities of recruiters and hiring managers; users often missed the information about the predicted number of candidates to reach an onsite stage, previously communicated with a pie chart.
My Role
Design Lead – I partnered with product and engineering to ideate, prototype, research and design the UI.
The Team
Lauren Allanson (PM), Alexa Lytle (UX Researcher), Andrew Zirm (Data Scientist), Orion Delwaterman (Engineer)
Goal
Using machine learning on tens of millions of candidate applications, our goal was to give recruiters the power to "see into the future" – to understand how likely candidates will make it to a face-to-face interview and when they are likely to make a hire. This will help recruiters be more proactive, decide which jobs need more attention, where to spend their sourcing budget and set expectations with hiring managers and finance team.
User Goals
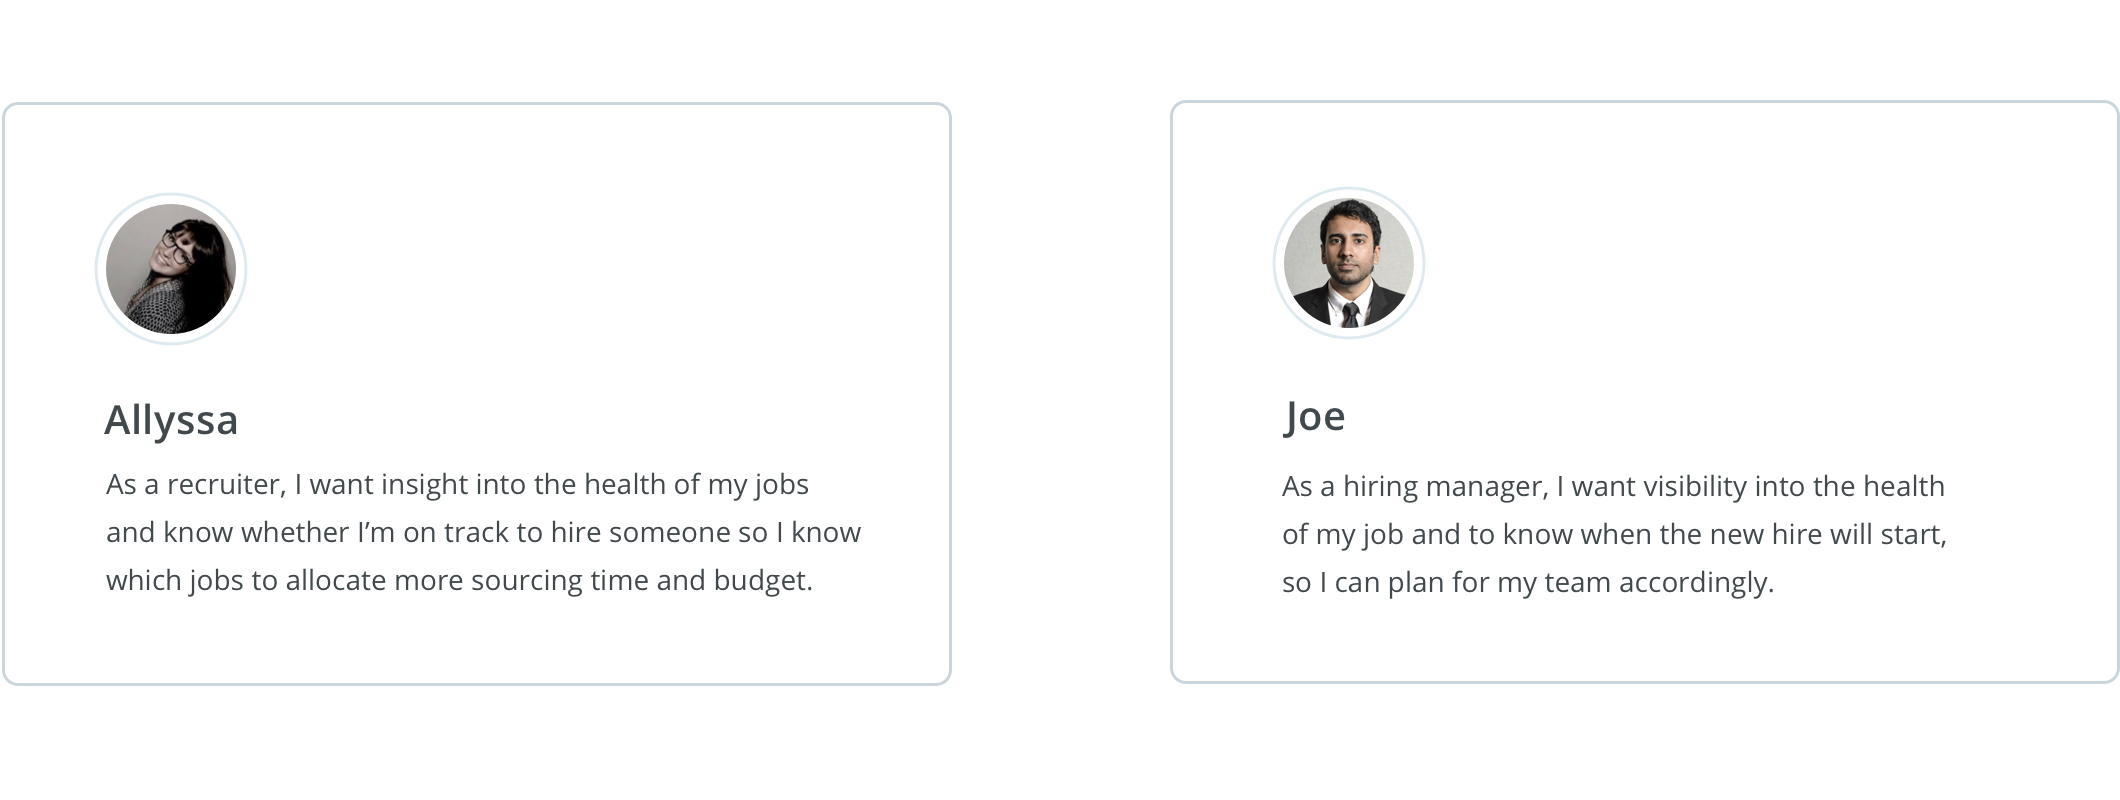
How Predictions are Made
To predict when a hire might start on the job, the data science team built a statistical model of job pipelines and candidates moving through them. Below are some of the factors in the equation that could affect the prediction. By using machine learning, predictions improve continuously over time as we understand your company's hiring habits better.

Research Objectives
We talked to recruiters from small, mid-market and enterprise size companies to validate our assumptions: Will people trust the data that we are presenting them? If we visualize the % chance a hire will be starting on a given week, will it be understandable to users? How accurate does the model need to be before we roll it out? Will we be able to change recruiter’s behaviors by telling them to set a start date vs. a fill date?
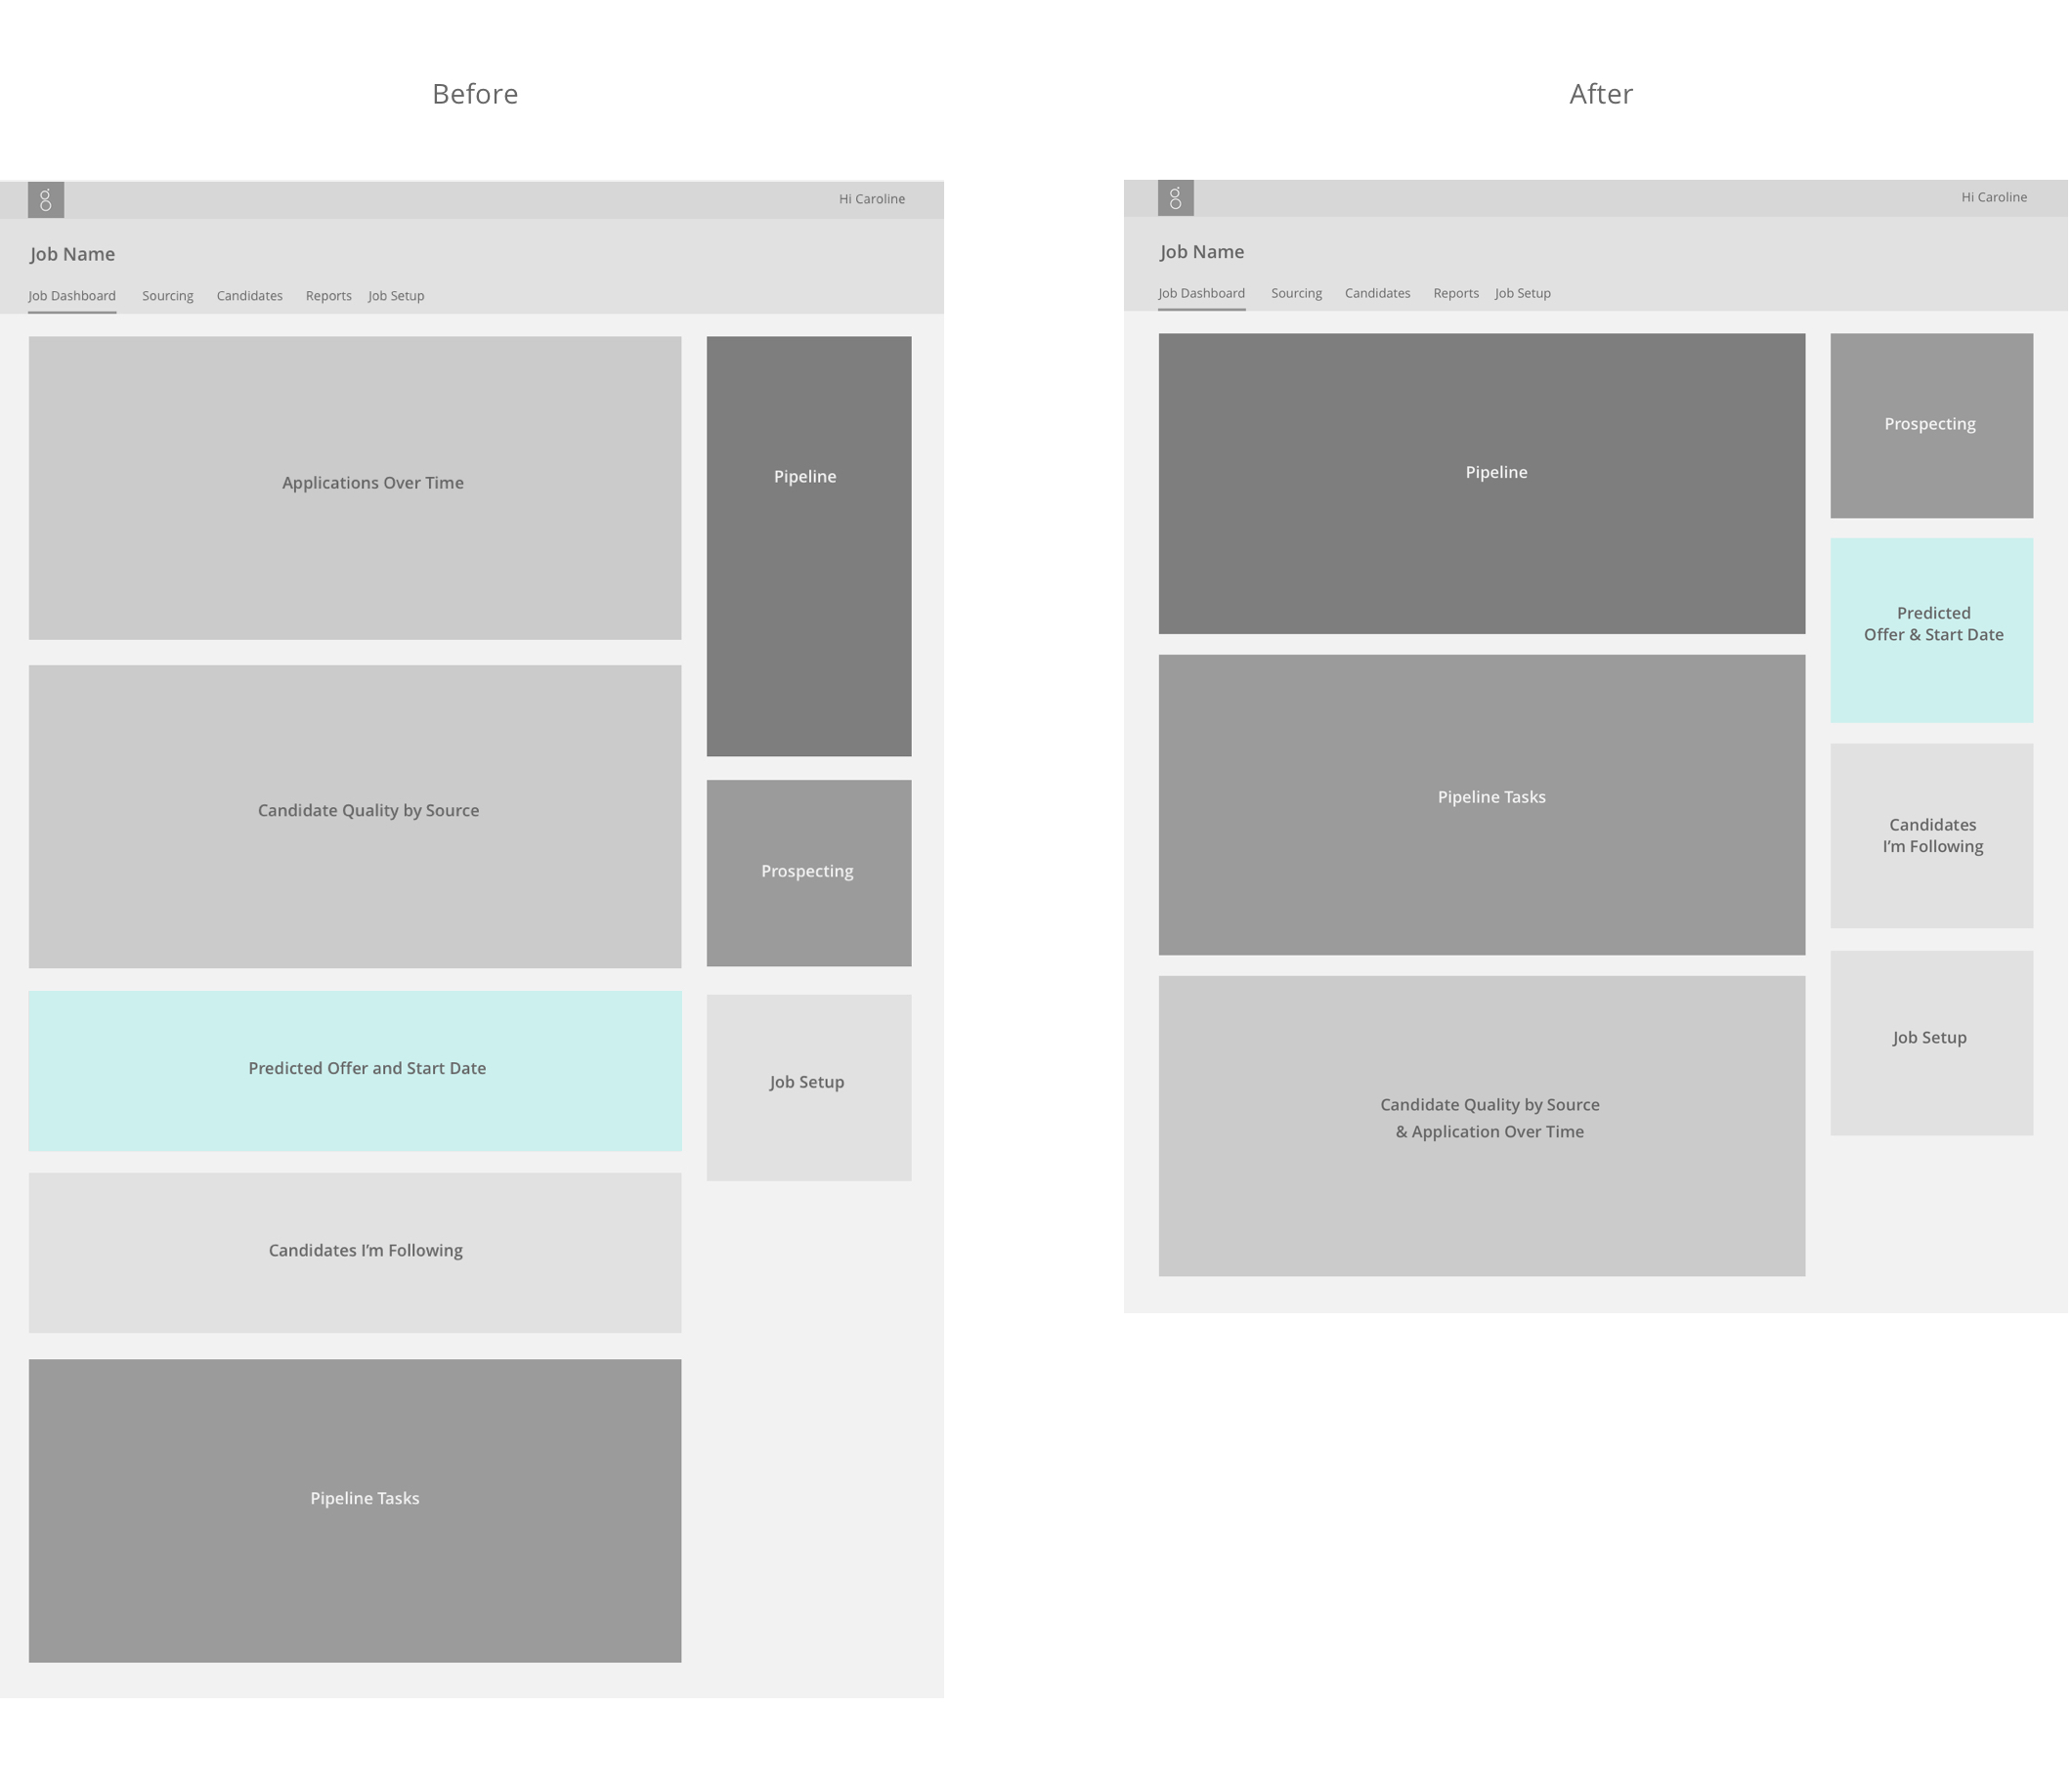
Looking at the Problem Holistically
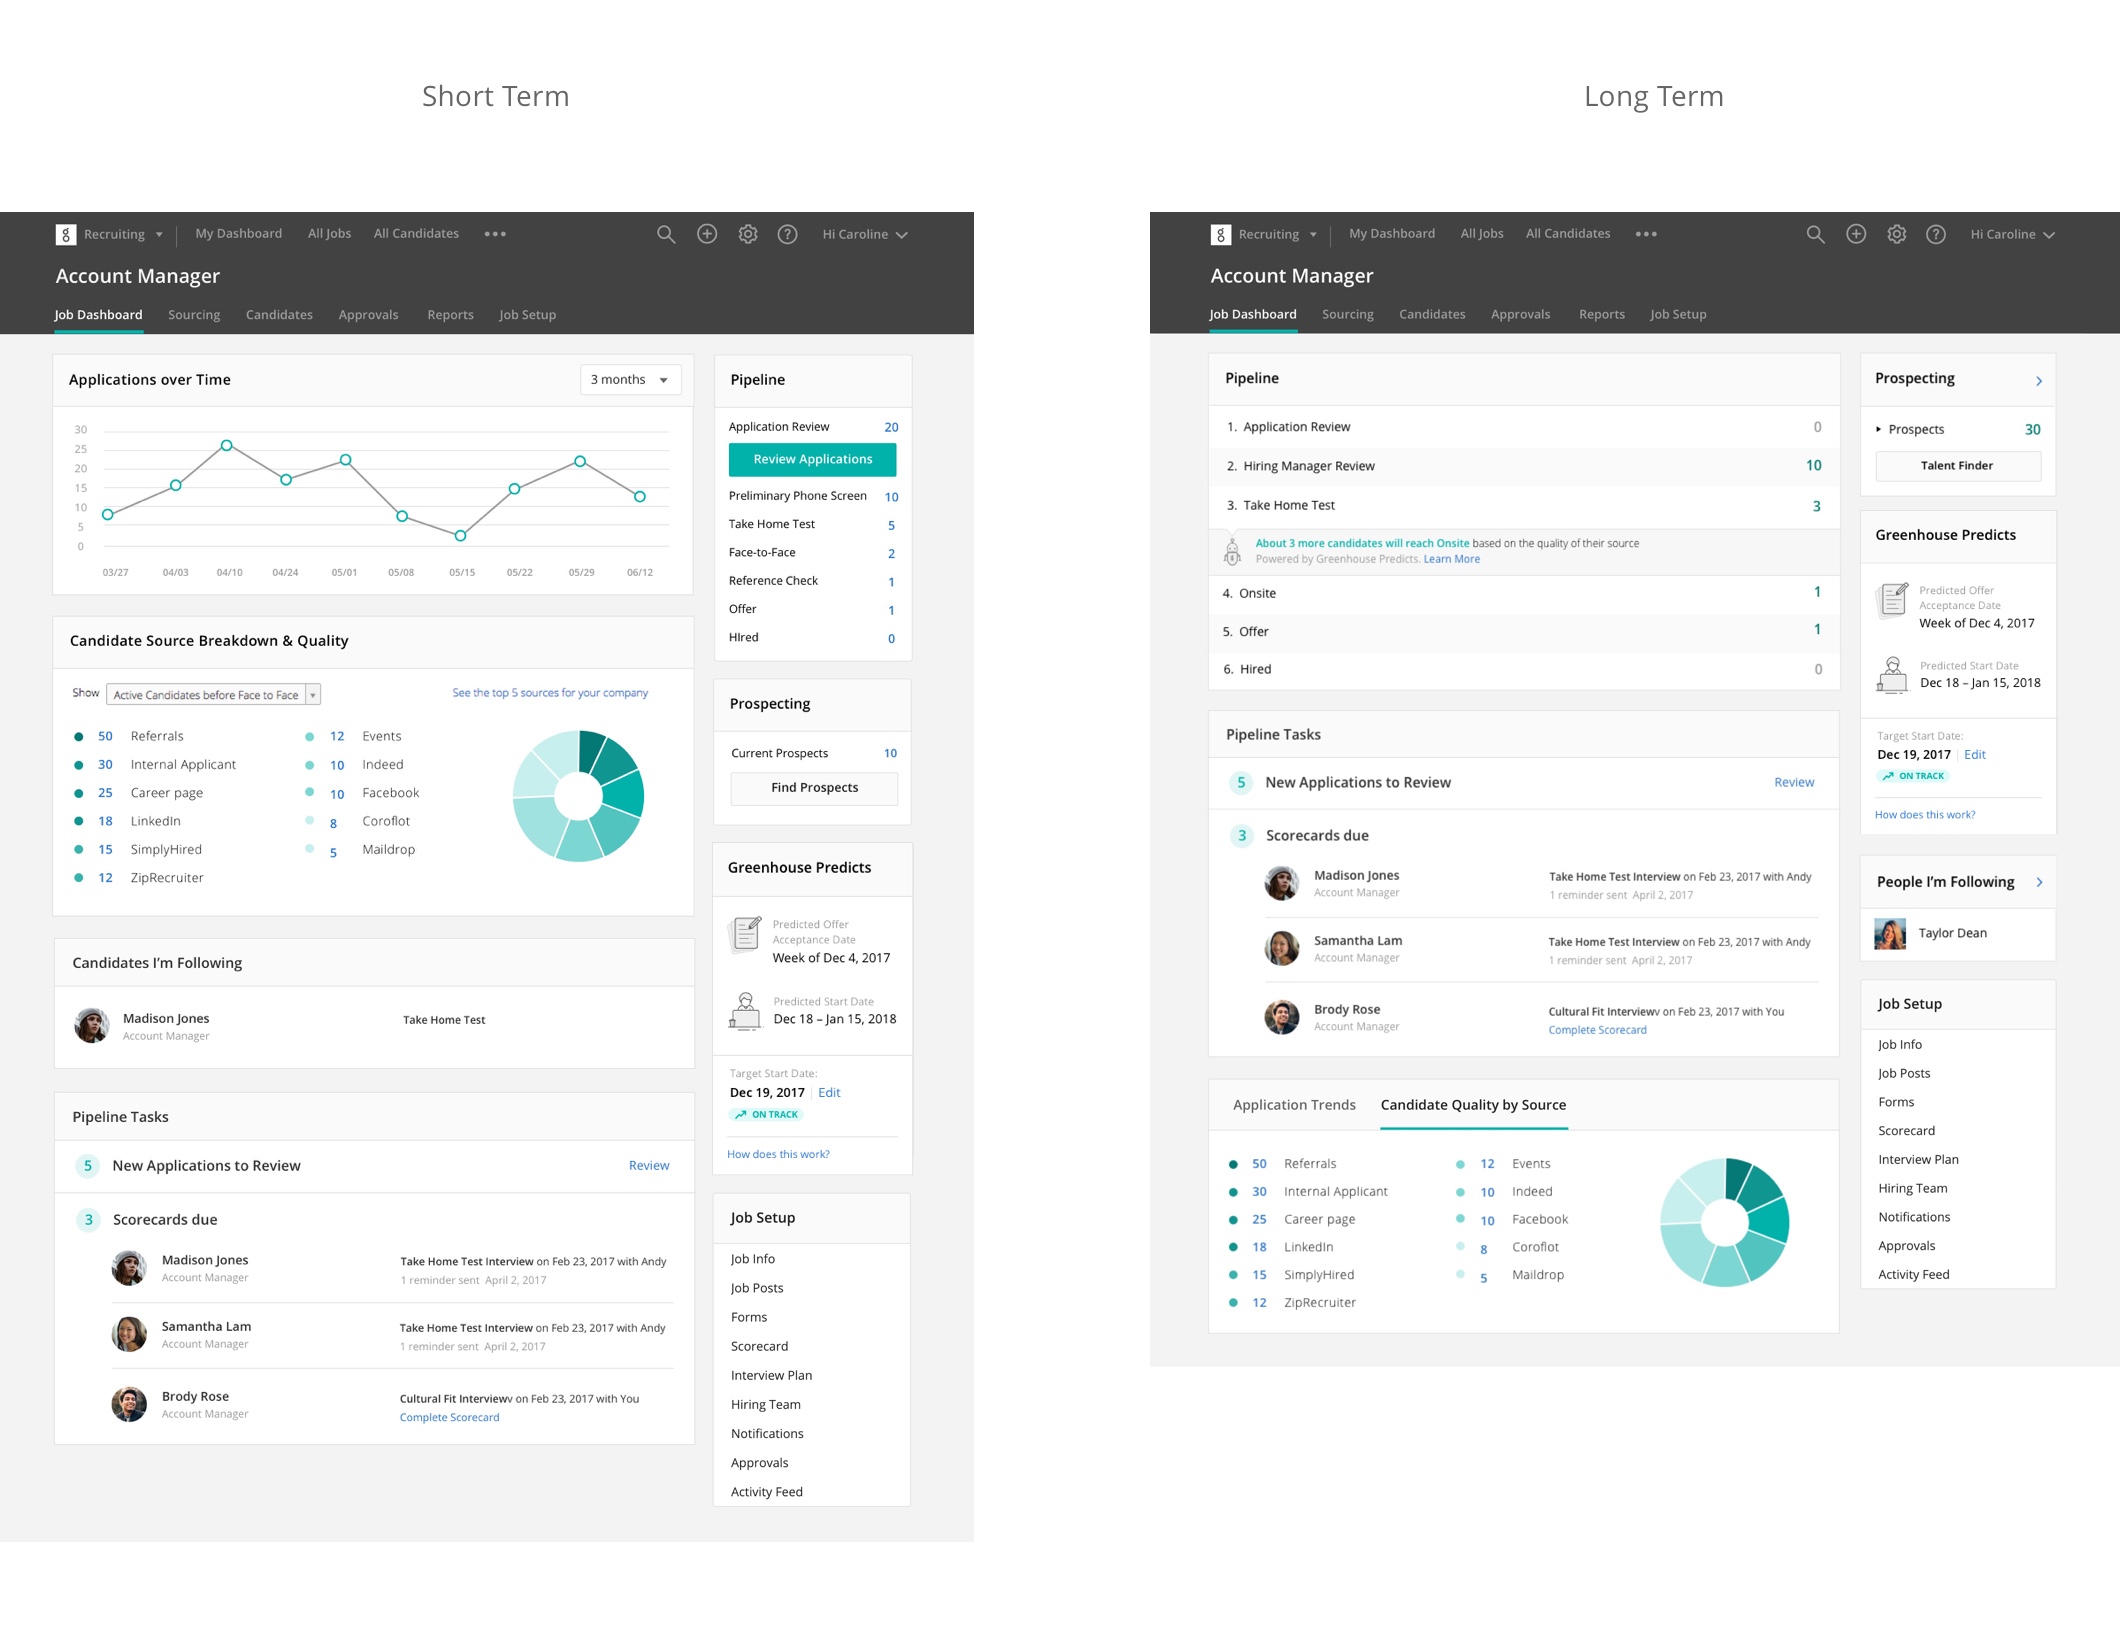
First, we asked ourselves why recruiters and hiring managers would visit the job dashboard – and we learned that the health the job and any immediate tasks were top priorities. Although we may not get to reorganizing the dashboard for MVP, it was valuable to understand how new features fit within the context of the bigger picture.
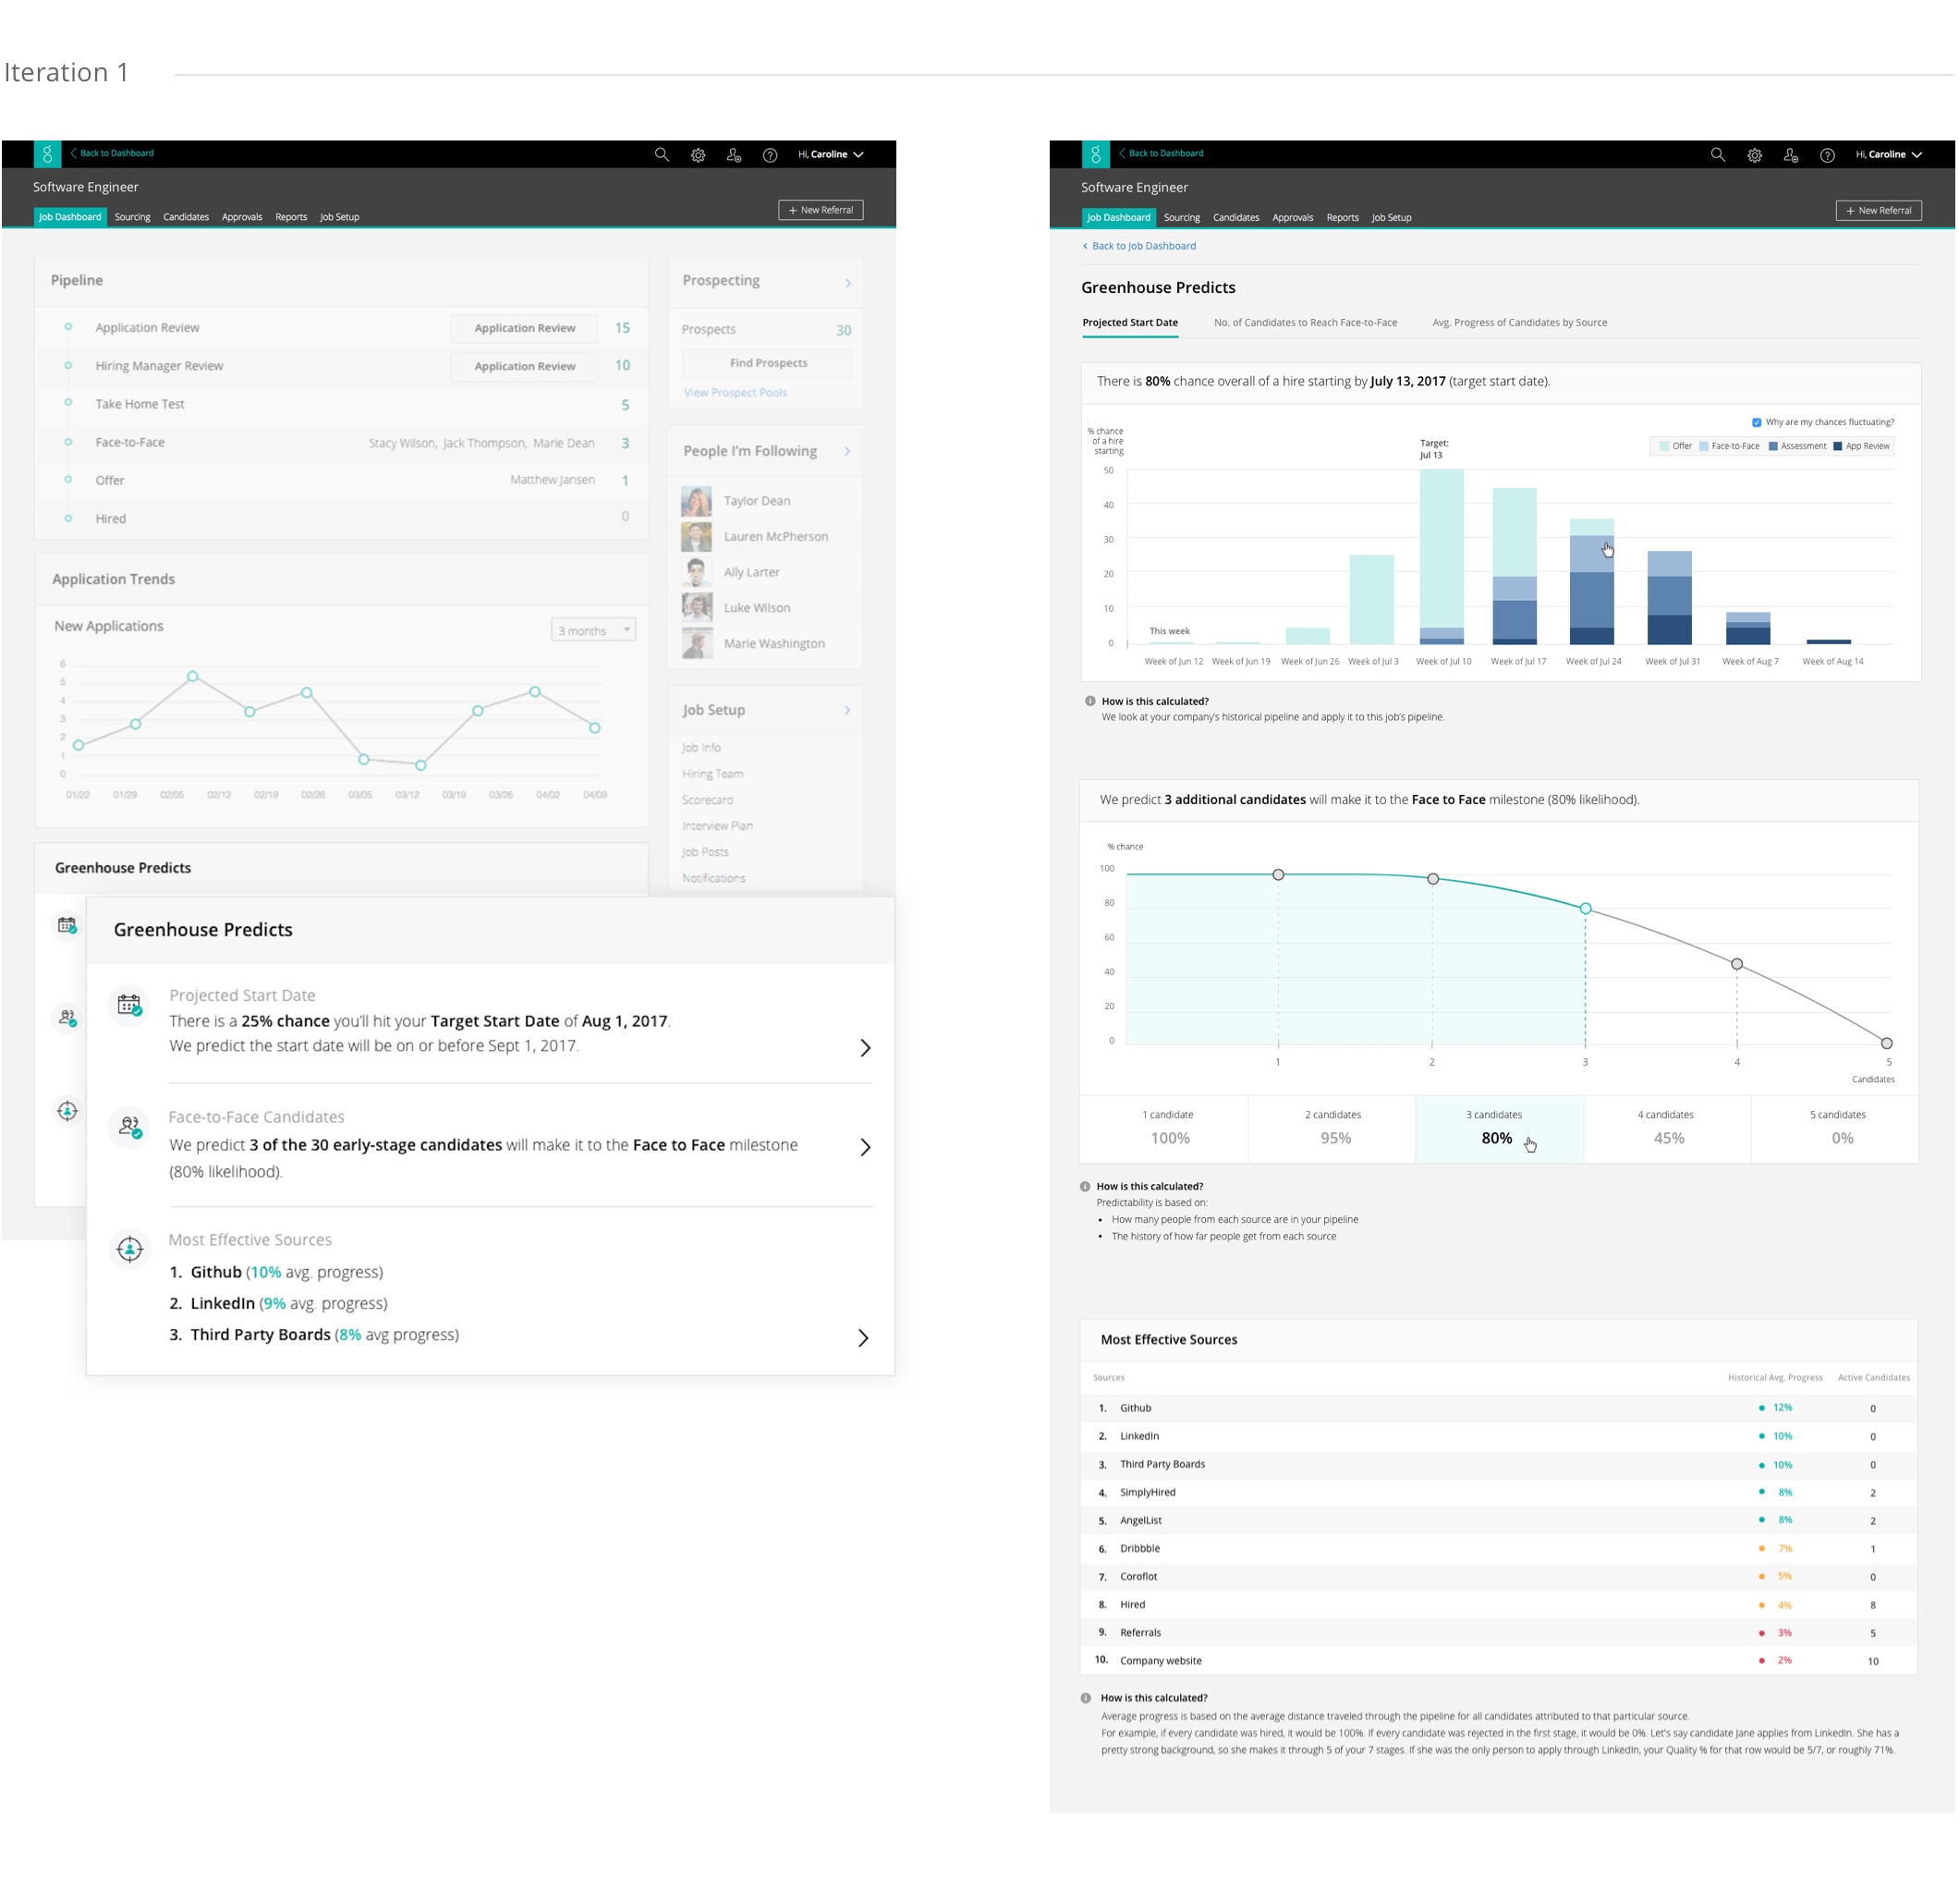
Explorations
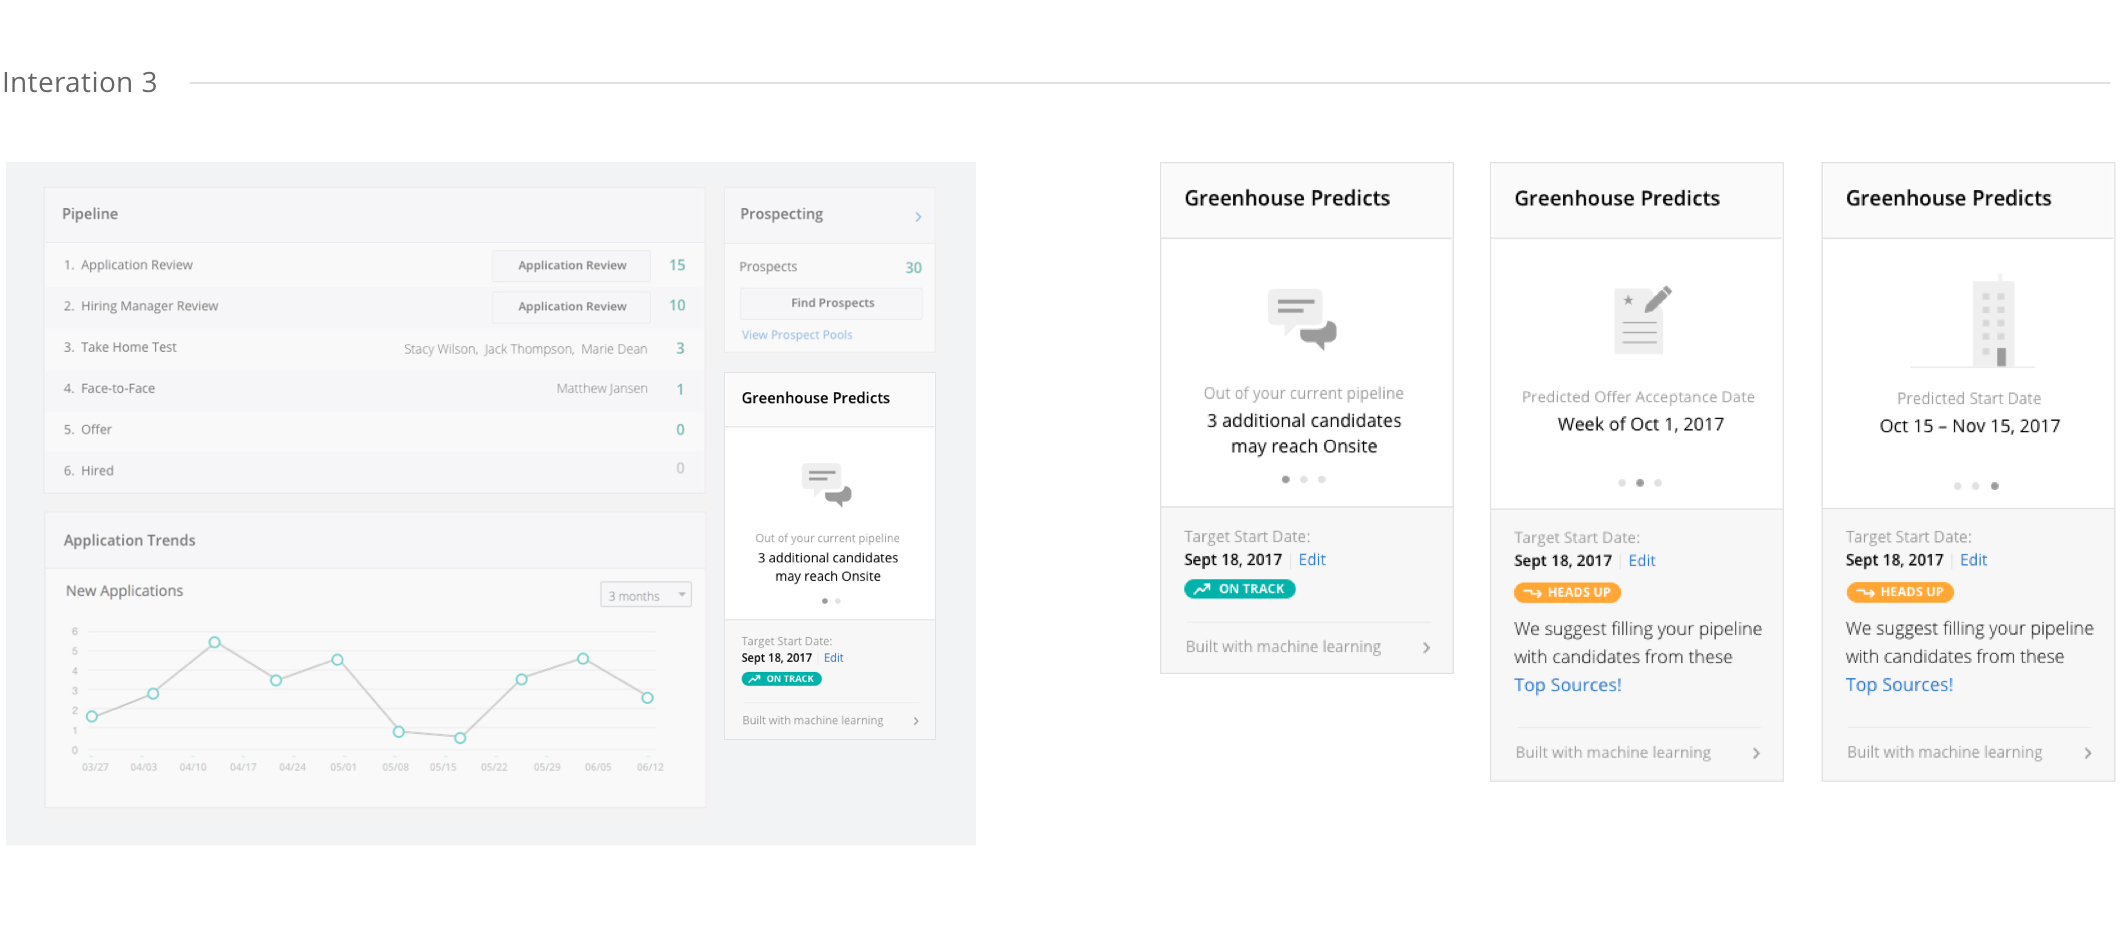
In the first iteration of this feature, we explored communicating the chance (in %) of hitting your target and explained how such predictions were calculated with visualizations to ease users' skepticism, however research proved this caused more confusion than clarity, and displaying the chance in % also added more cognitive load. View Prototype
In the second iteration, we simplified the module by bringing more focus to when a hire will be made, and providing a binary status: the job was either "on track" or "off track" to hit the target start date, which was easier to digest than a % chance. A few usability sessions later, we learned that the prediction seemed harsh to users when the job was "off track" – this led us to soften the tone of the UI copy, while also offering a suggestion on how to get back on track.
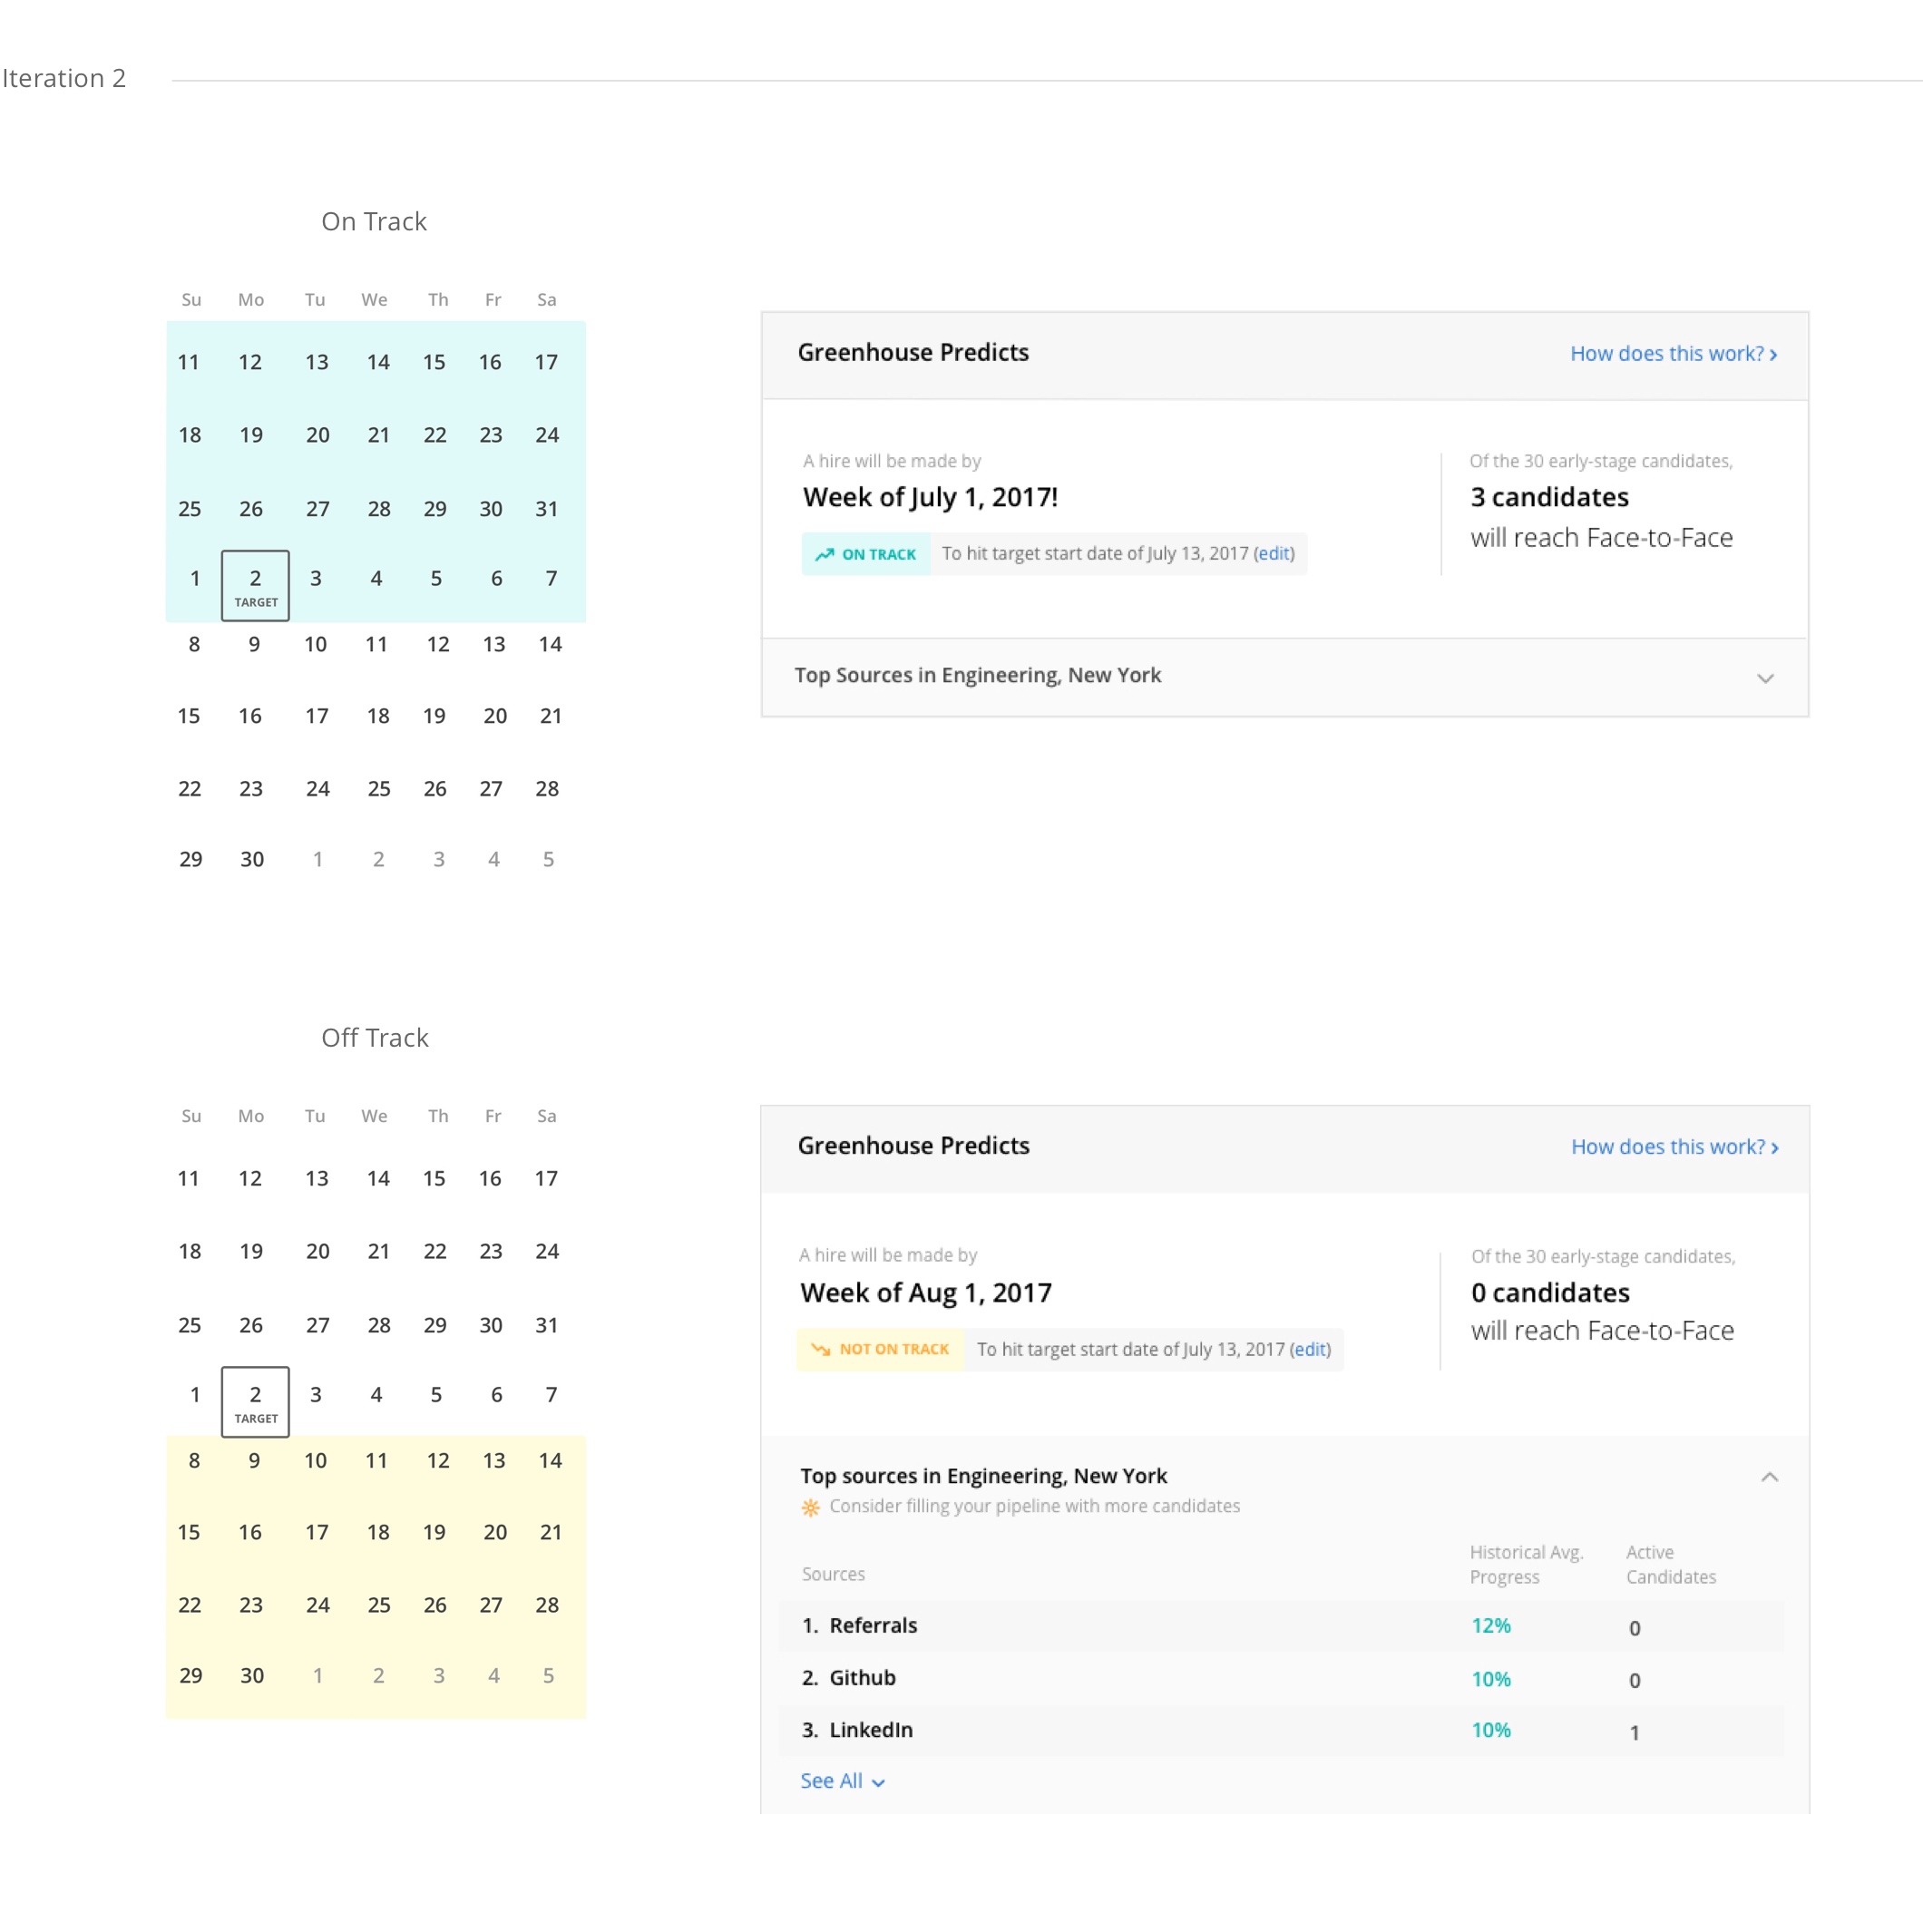
Although recruiters were excited by the concept of predictions, they also feared setting false expectations with hiring managers. As a result, we broadened the predicted start date range from 1 week to a month. The "start" date also didn't resonate as much with recruiters as an "offer" date, so we bridged the gap by showing both predicted dates. To avoid disrupting users' workflow, a smaller footprint of the module was explored with a carousel UI to display a single piece of information at a time, however the lag between offer and start date still wasn't ideal.
Launch
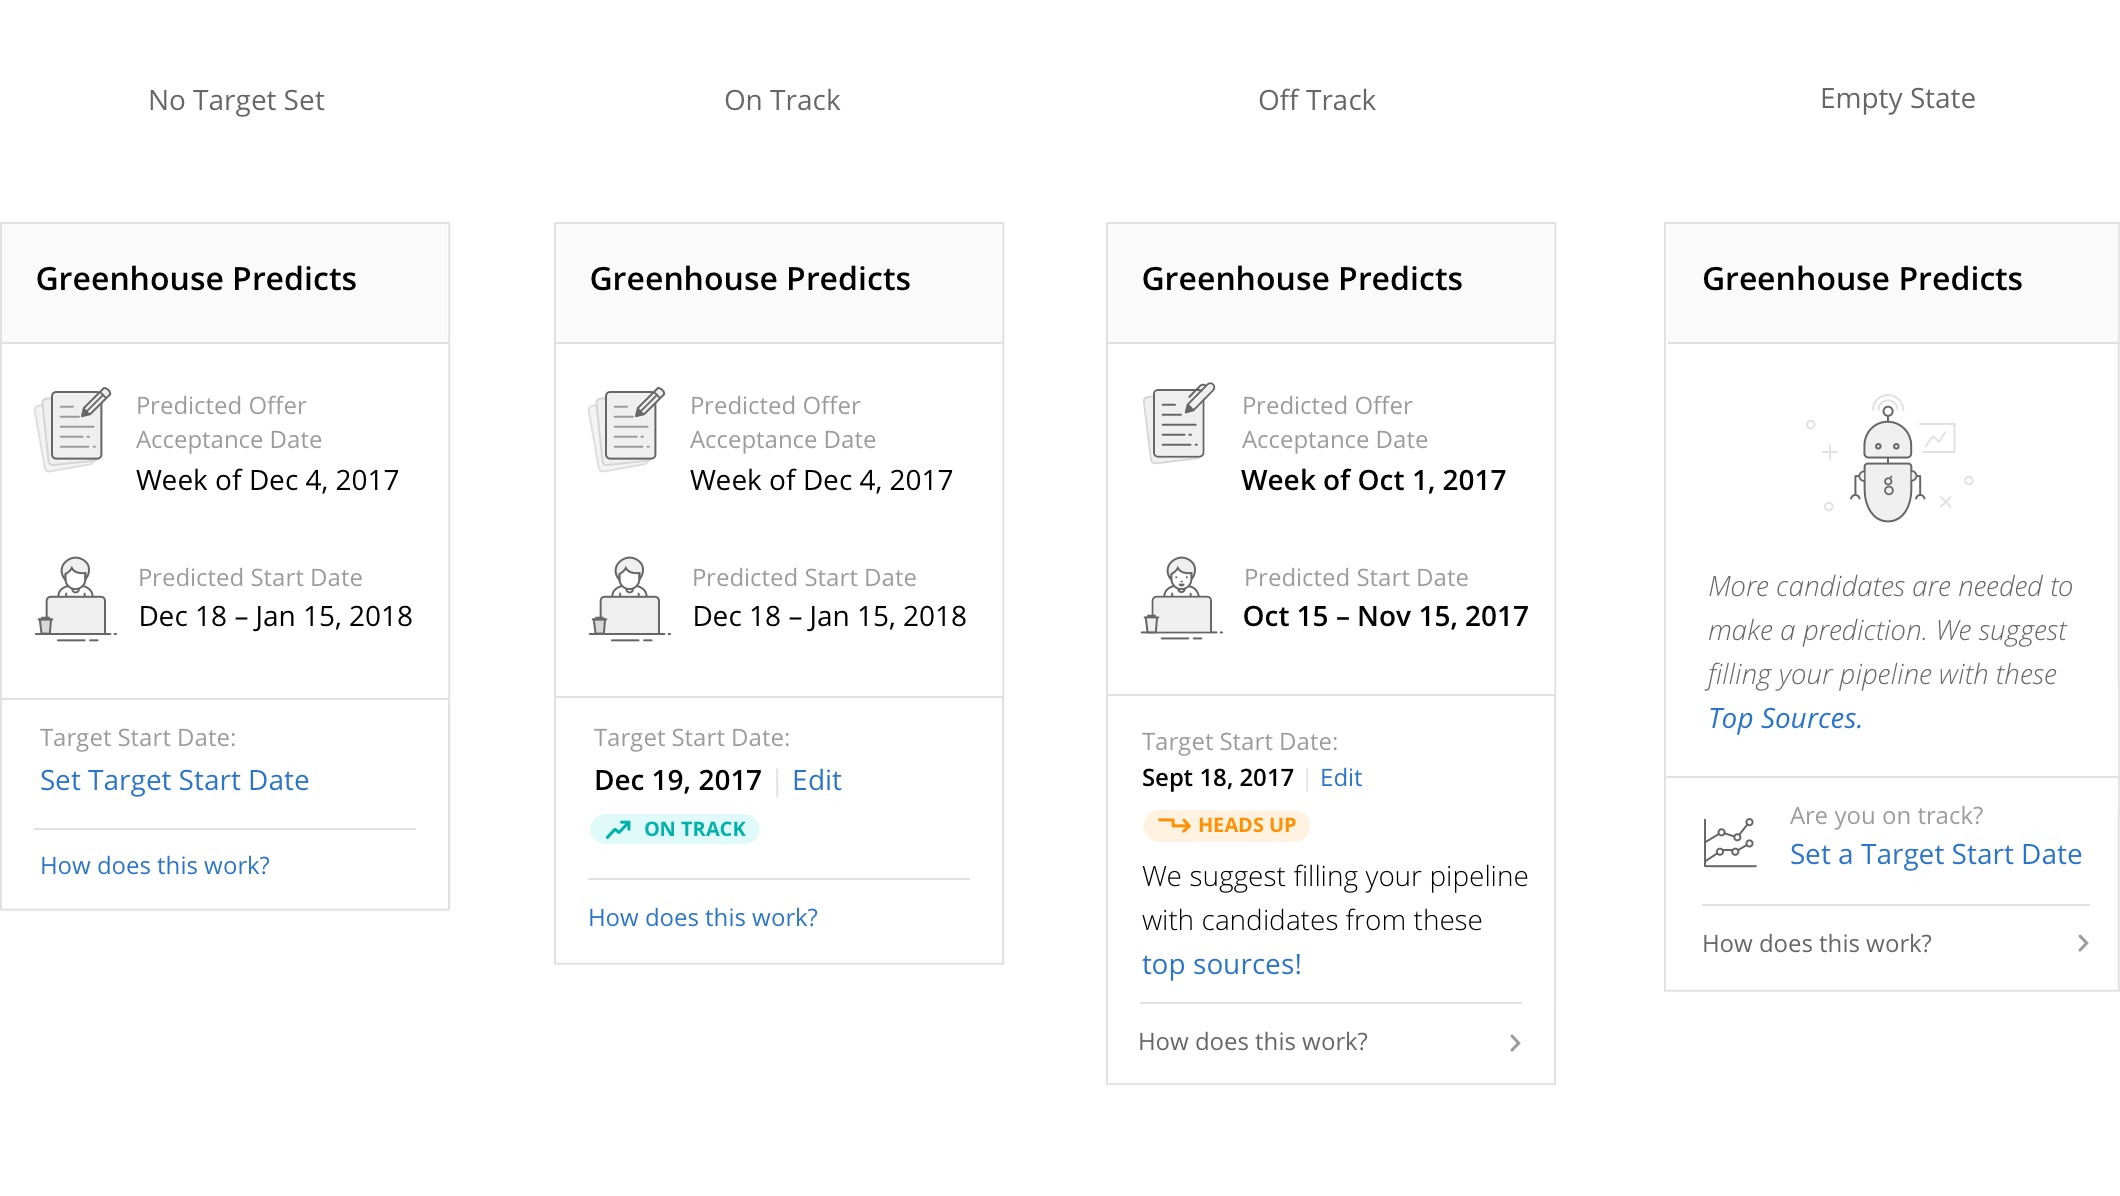
To simplify the module, we decided it was best to move the predicted number of candidates to reach a face-to-face stage, to the pipeline module, where it felt more contextual to recruiters' workflow (however this was not part of MVP). This freed up some space to display the predicted offer and start date in the same view.
Stylistically, the status labels needed to be differentiated from the treatment of our existing buttons so it doesn't appear clickable, and the icons needed to feel cohesive with the icon set across the product – the latter played a big part in drawing users' attention to the predictions, making it more approachable and easier to scan.
We held off on reorganizing the job dashboard so we could focus on improving the machine-learning platform to deliver more accurate predicted offer and start dates and provide more visibility across the org. As for communicating how predictions are made, we created a video in the help center, outlining the details of the statistical model that generate the predictions, which was still easy to find, but reduced development time.
Results
Users felt motivated by the predictions, as it provided a baseline for recruiters and hiring managers and they wanted to "beat the system". We also learned how valuable it was to offer guidance to recruiters on how to get back on track, when it looks like their jobs won't be filled by their target date. From a process standpoint, we saved engineering time by conducting user research early on in the process to determine what was the most intuitive and actionable for users. We'll continue improving our statistical model by listening to users' feedback regarding the accuracy of their predictions.