Greenhouse Report Builder
Background
Some companies have dedicated business analysts and have their own BI tool, other companies don't have the resources and use Greenhouse's prebuilt reports to answer reporting questions – but many companies fall in between and want to customize their reports in a way that's most relevant to their organization, to understand the health of their hiring operations.
My Role
Design Lead – I partnered with product and engineering to ideate, prototype, research and design the UI.
The Team
Alex Powell (PM), Alexa Lytle (UX Researcher), Rob Rosenbaum, John Nguyen, Mark McDonald, David Han (Software Engineers), Camille Seda (QA)
Goal
Allow users to build their own reports that give them visibility into their pipeline, help them observe trends over time and compare key metrics; to save reports for easy access in the future, and schedule them to be automatically emailed so these reporting insights can be shared across the organization.
User Goals
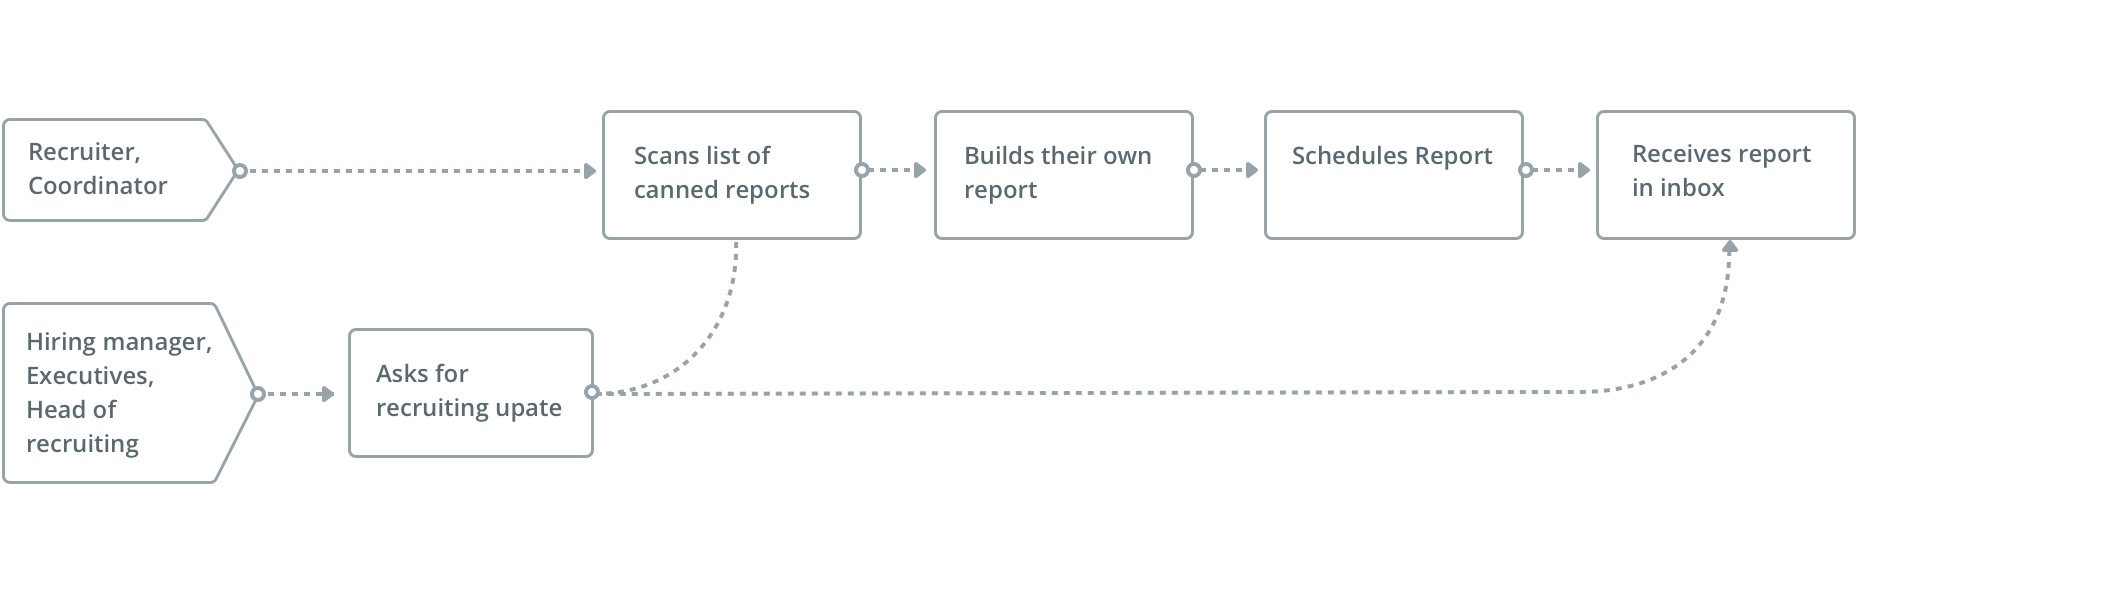
User Flow
First, it was important for everyone on the team to understand what the user's route would look like in Greenhouse for them to locate their desired report. When mapping this out, we asked ourselves: How might we empower recruiters and coordinators to get the data they're looking for when requested by their hiring manager, executive or head of recruiting?
Theories
Our initial theory was that people could find the data they needed if we allowed them to build a report through a series of questions, with each answered question configuring different aspects of the report. After a few rounds of usability testing, we learned this was very cumbersome and unclear to users because they couldn't see what effect their various choices would have in the report. As a result, providing a preview of the report early on in the flow became a priority.
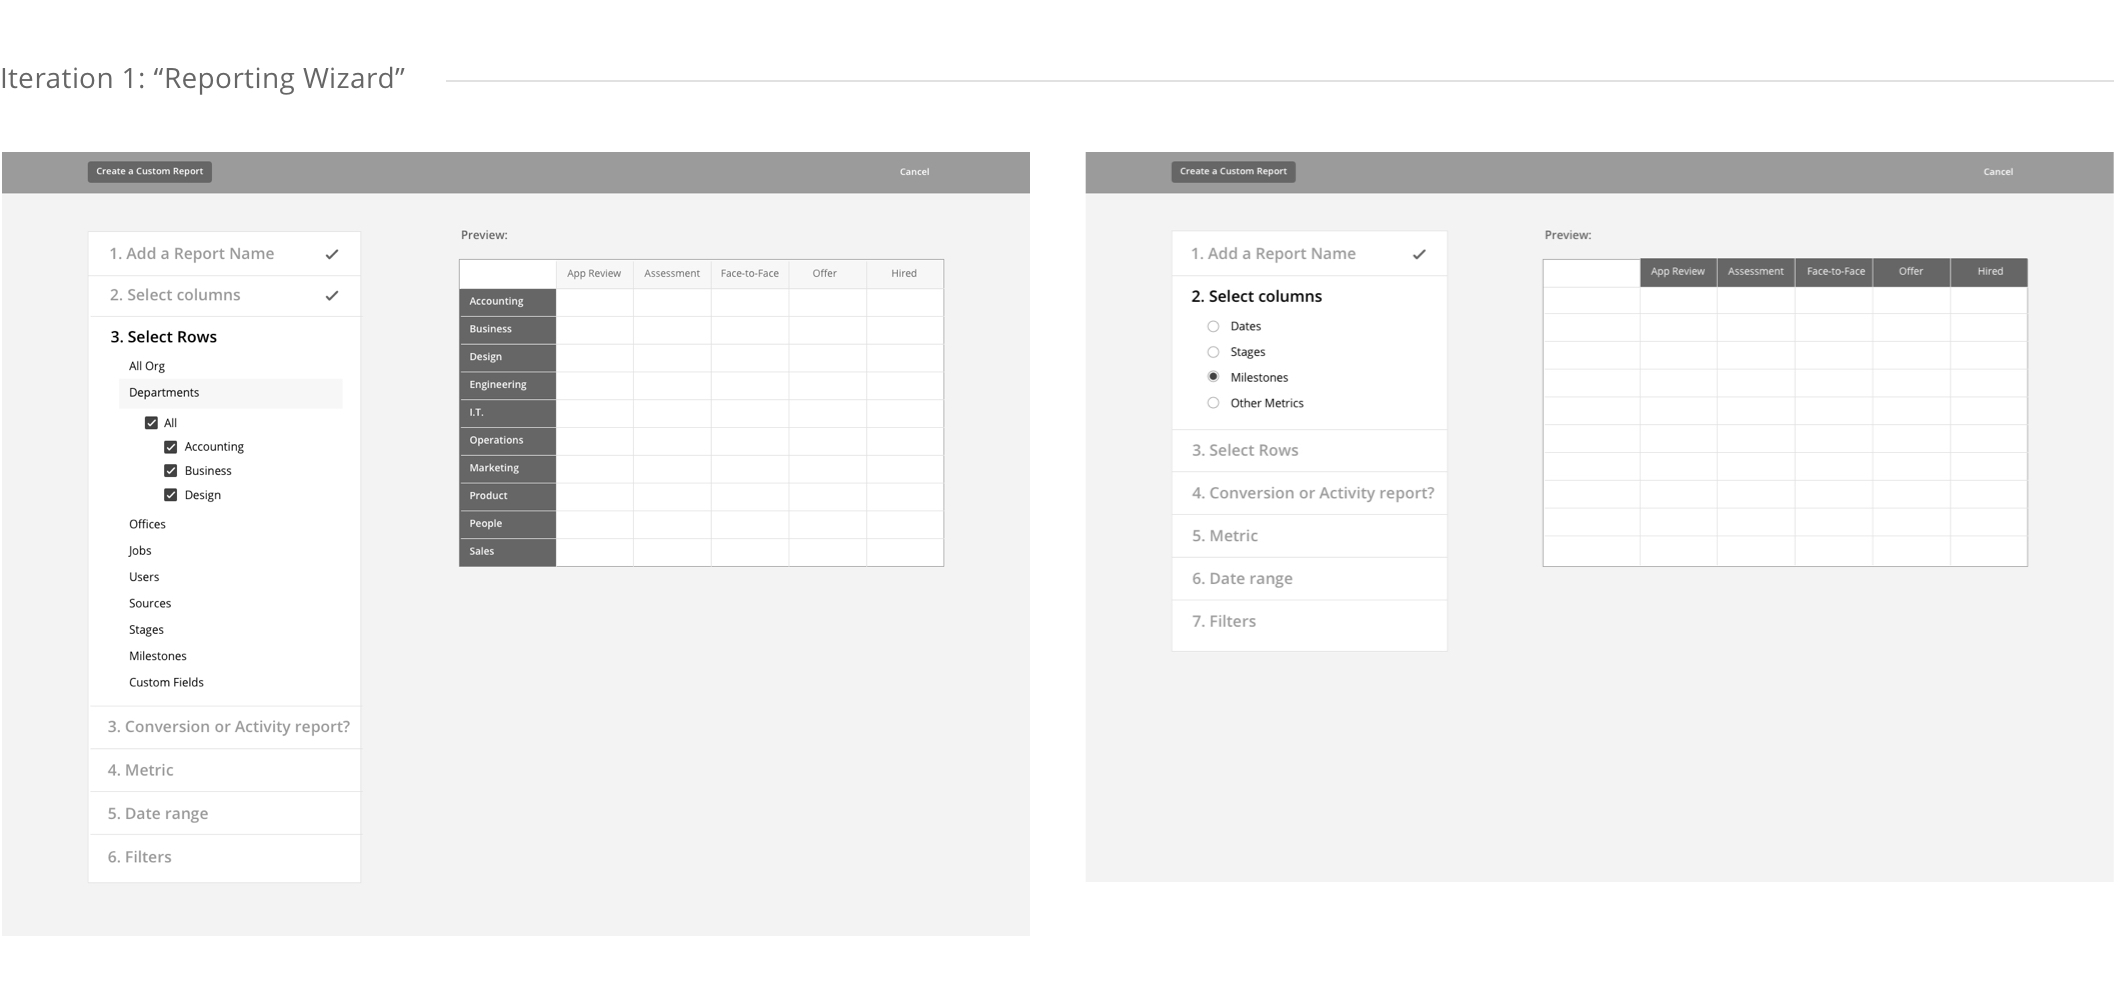
Wireframes
A few iterations were explored in attempt to communicate which aspect of the report you were setting up. The "reporting wizard" provided a preview on the right, as you navigate through each question, however displaying their actual data required more development effort, and if sample data was used, it would have been misleading.
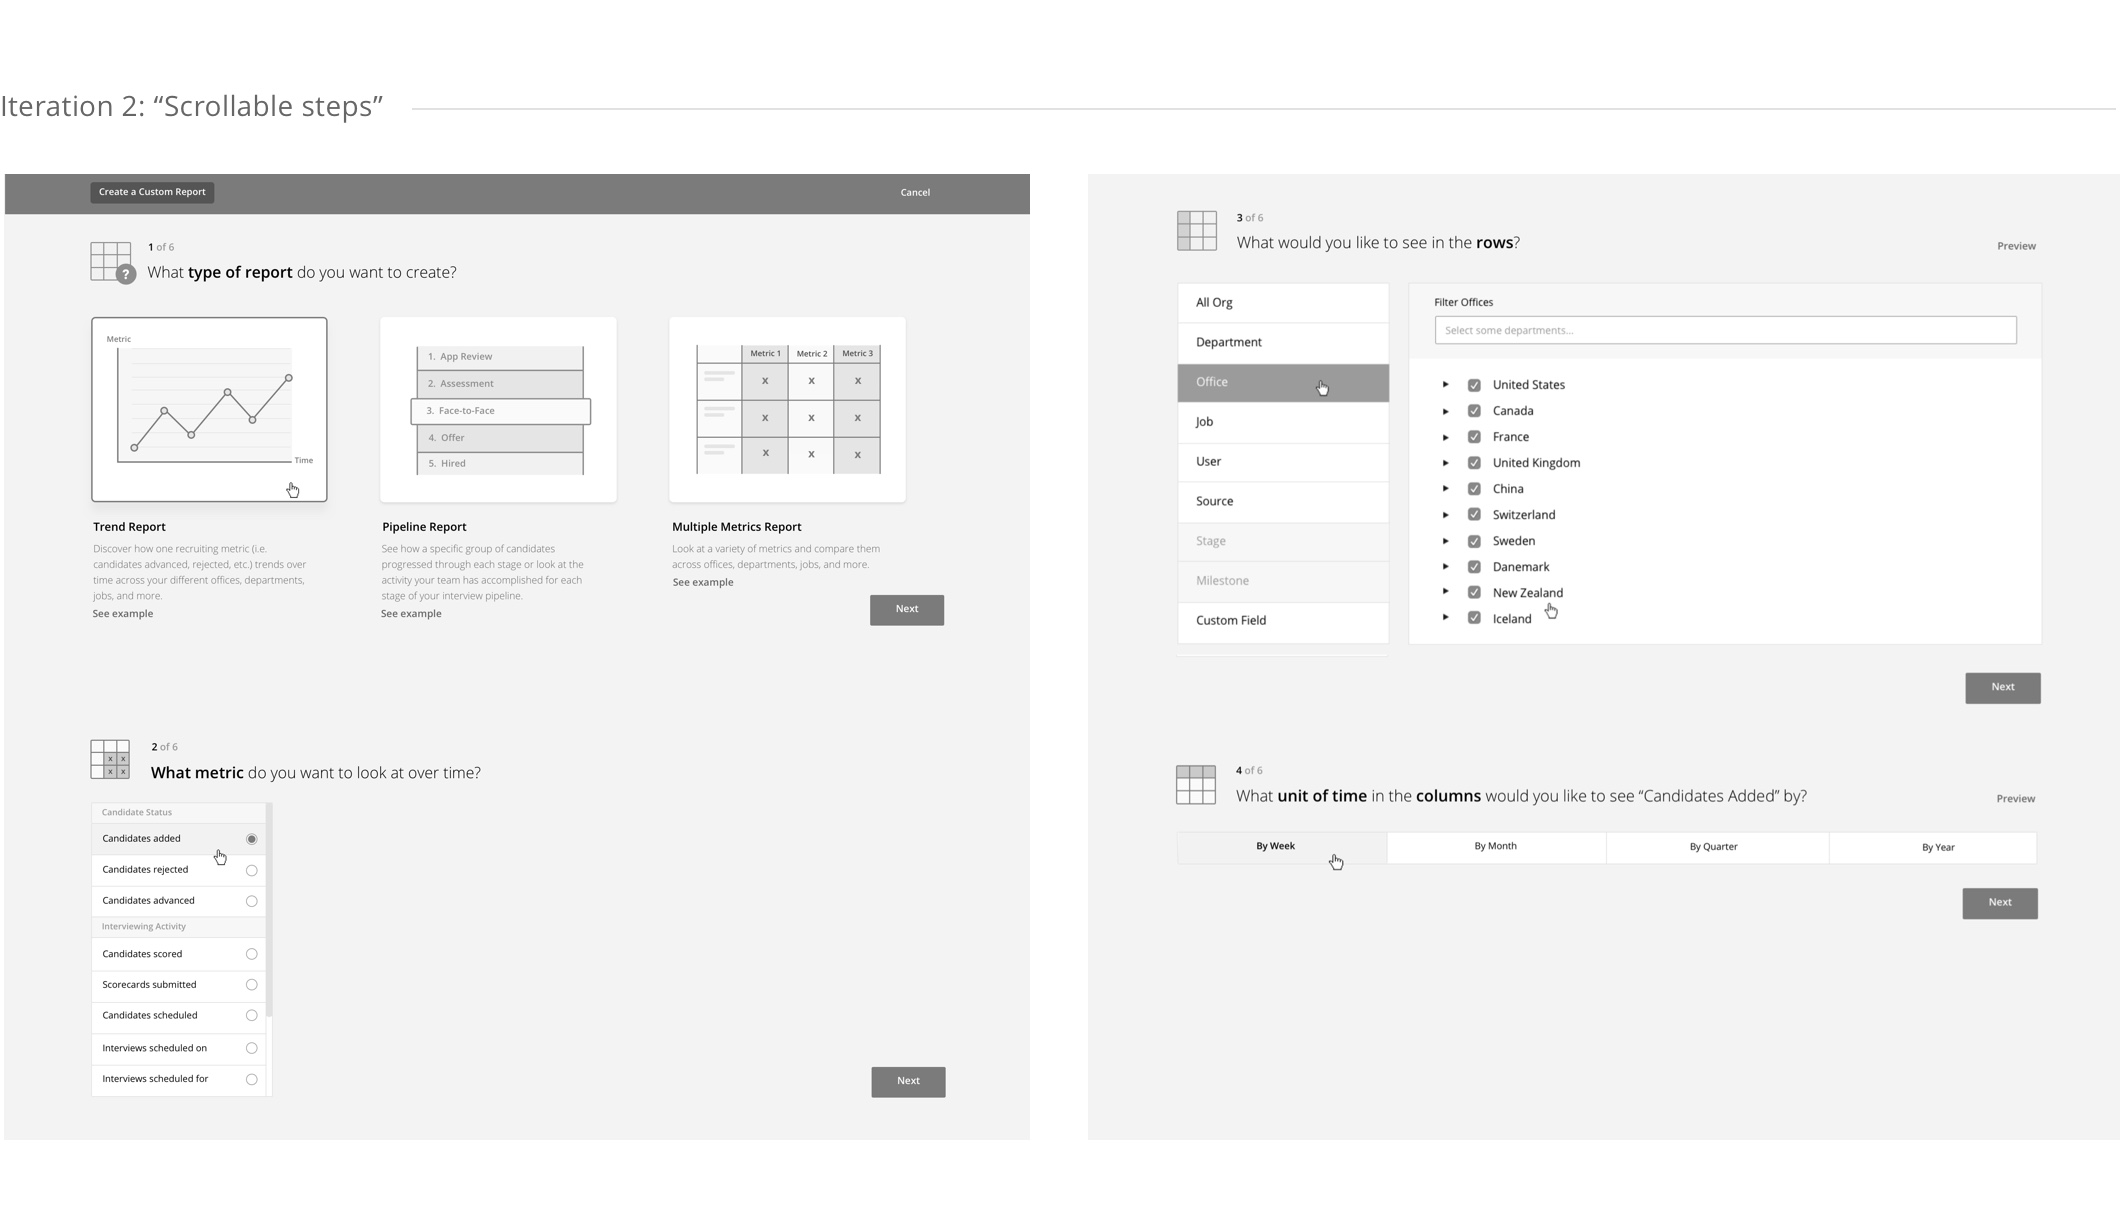
The "Scrollable steps" iteration was an alternative to showing a preview and relied on icons to communicate which aspect of the report you were configuring (e.g. rows, columns, filters, etc.). Hitting "next" would auto-scroll down to the following question and edits could be easily made by scrolling back up. (see prototype). In the end, we learned nothing was more powerful than seeing the actual report table itself, before deciding what filters or edits to make.
Launch
In order to provide a preview of the report early on, you would simply click on a "Build a Report" button from the reports main page, and complete 2-3 steps within a modal. Illustrations played a big part in communicating the different type of reports you can build, making them easily scannable and helping users feel more confident in their choices.
The pipeline reports allowed you to understand 3 things about the interview process for any particular job: how candidates have historically progressed through each stage, how many candidates are currently in each stage and all the activity your team as accomplished during each stage. To communicate this, the visuals and copy for each report type needed to feel cohesive, but subtly different to represent the data.
When previewing the report, you can see how your choices are reflected in the table, make edits, apply any necessary filters (e.g. jobs, date range) or change the row view. In the past, the report was automatically generated after a single filter was selected, however this took much longer loading times, so we moved towards a paradigm where multiple edits or filters can be selected before generating the report. See Prototype
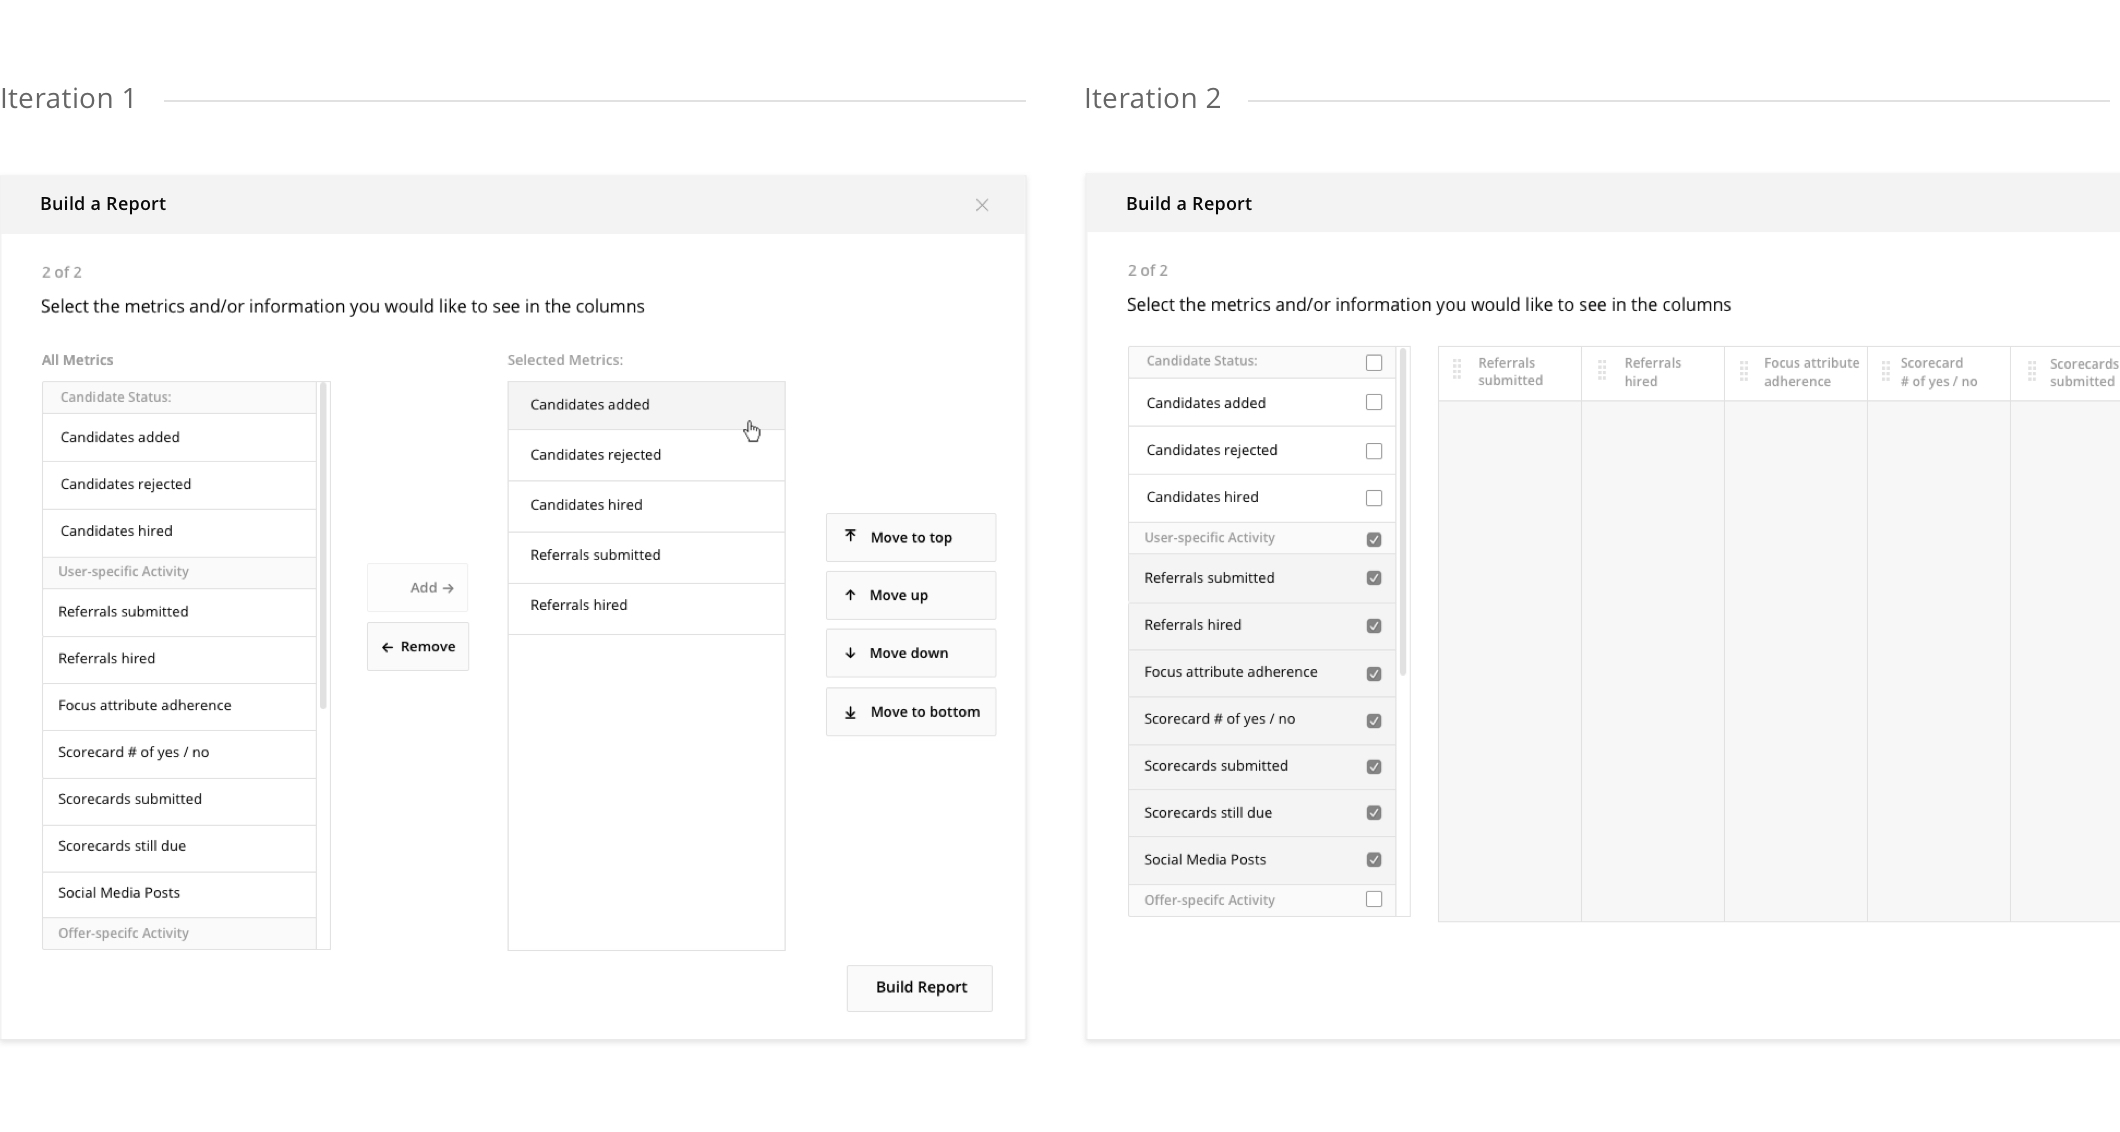
If you choose to build a "multiple metrics" report, you're asked to select the metrics that should appear in the columns of the table. Early explorations of this UI involed either a lot of clicks and additional buttons or wasn't ideal in the context of a modal – in the end, we simplified the interaction by having your selection of metrics (left) automatically appear in the column view (right).
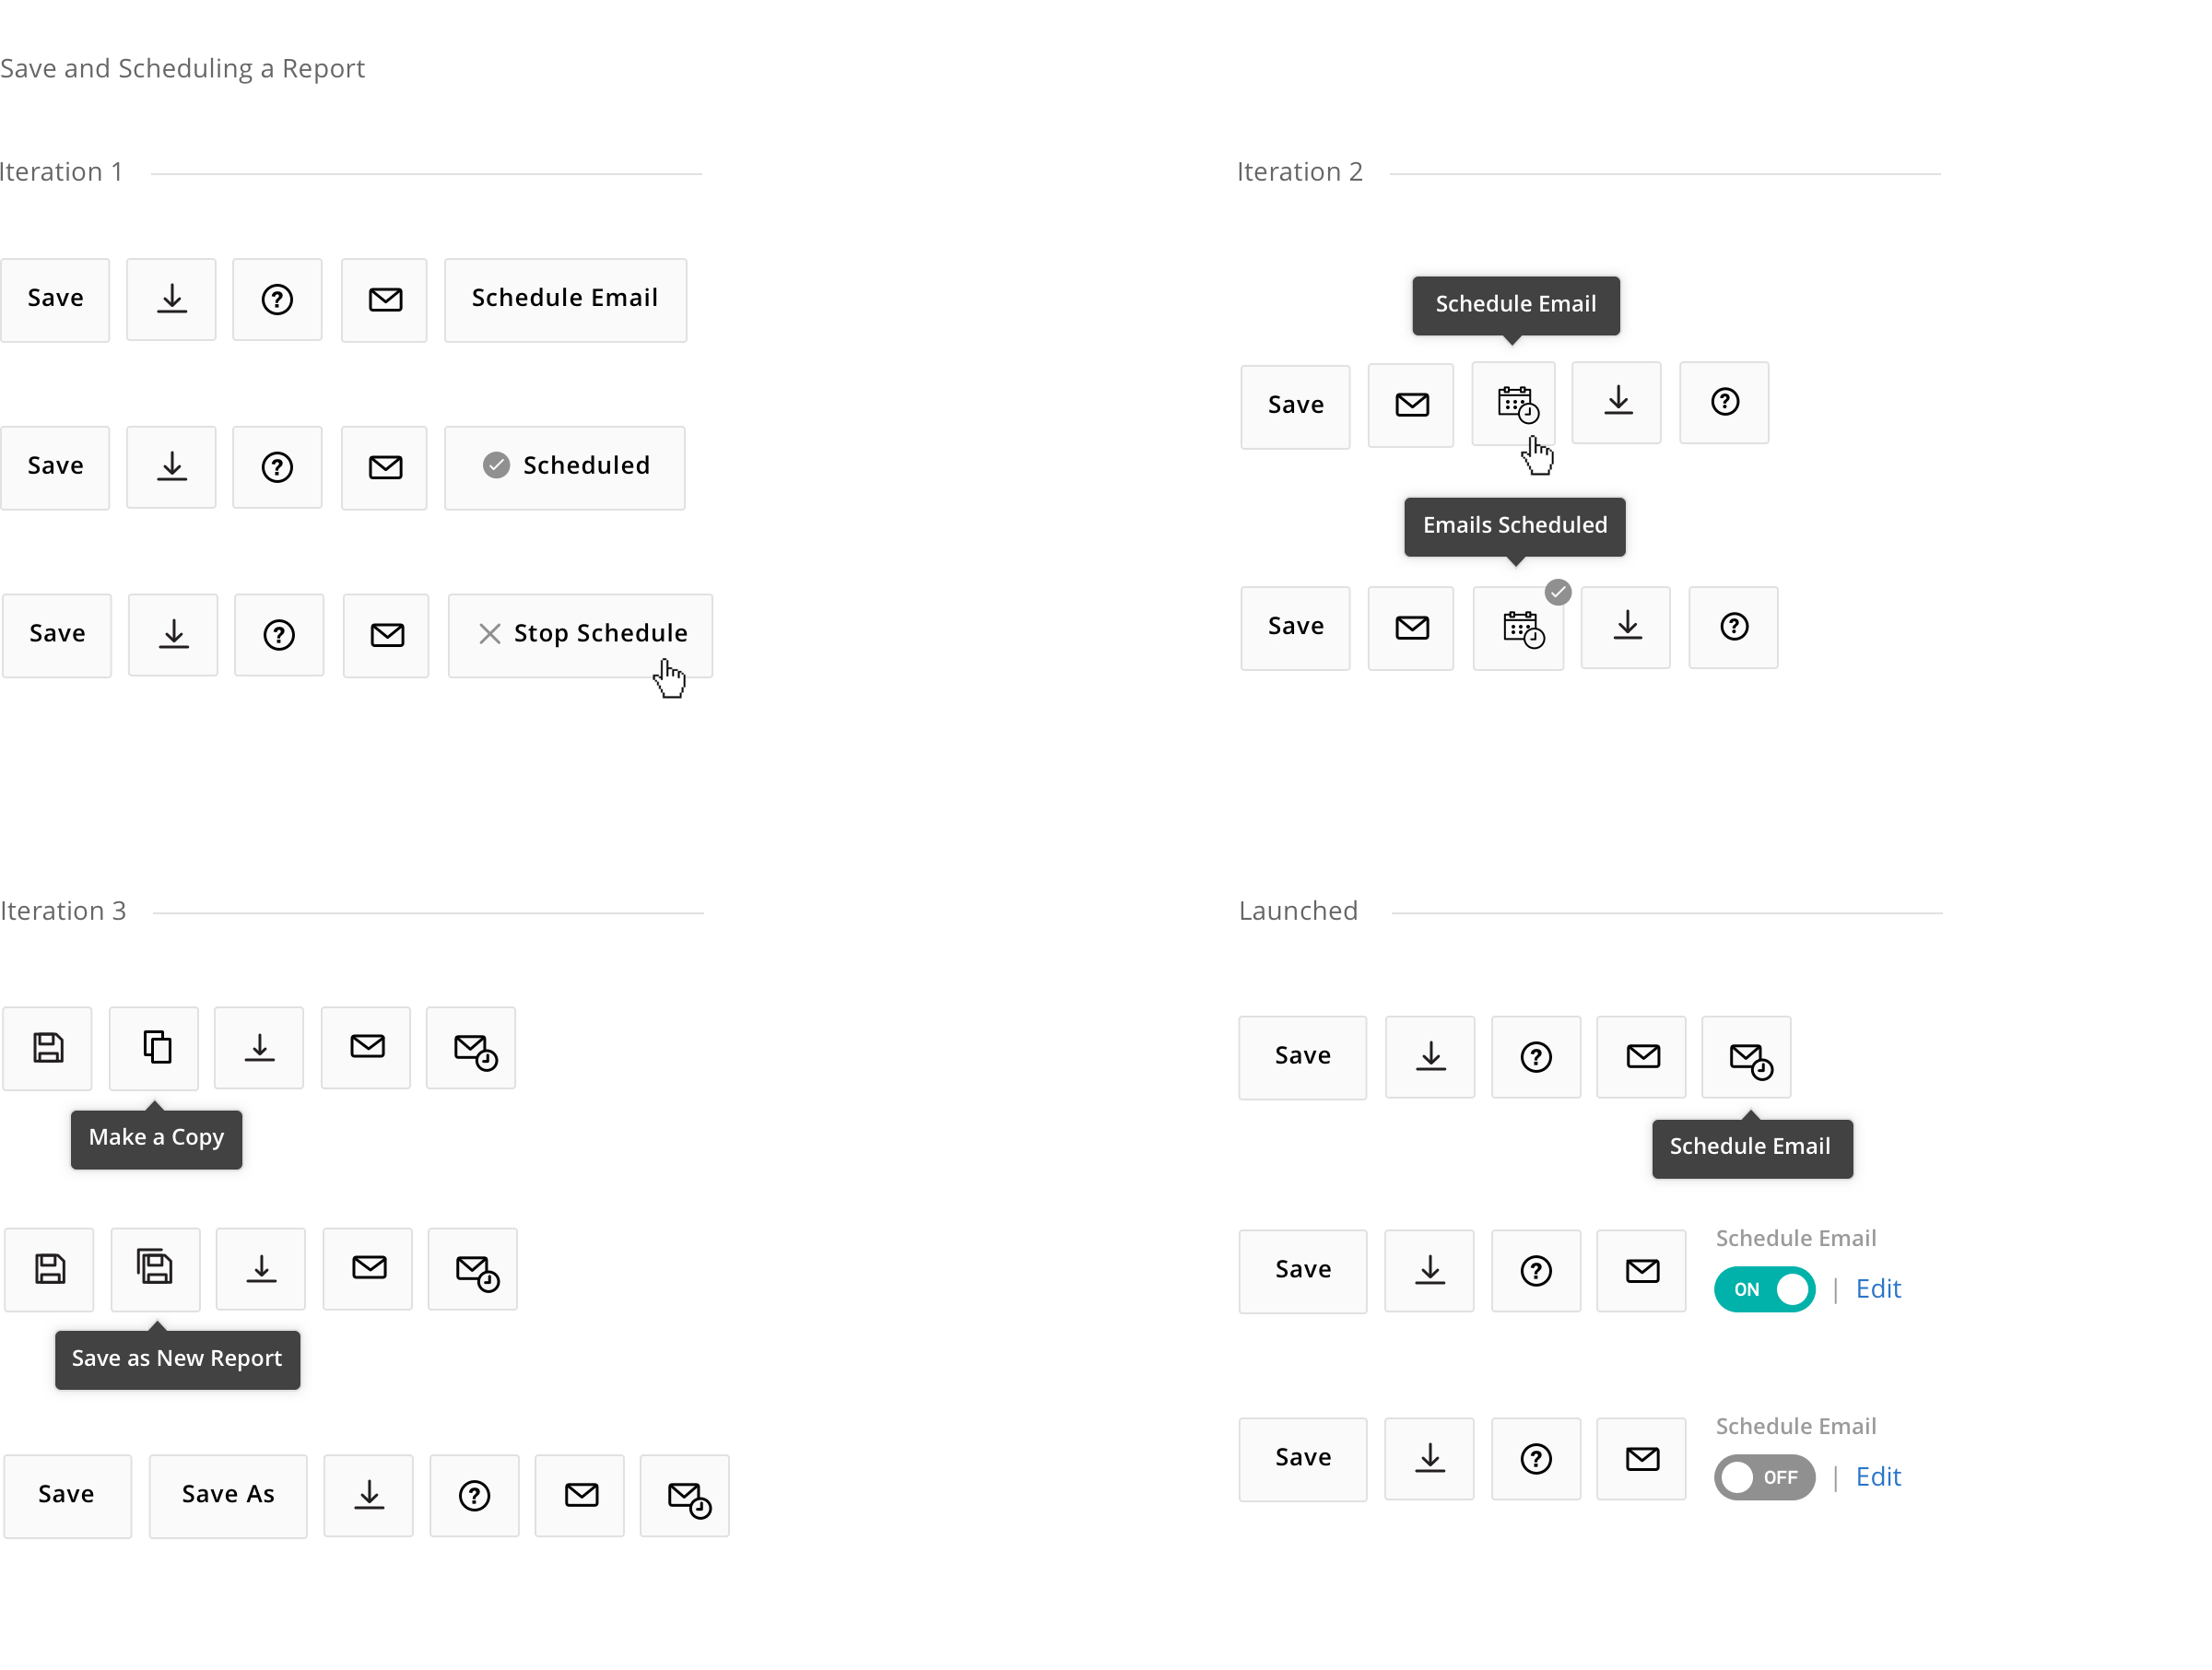
Once a report is built to your liking, you can then save it and set up an automated email to be sent on a schedule, so executive teams could have visibility into the hiring process. To save time in building additional reports, you could also duplicate an existing report. Throughout the design, we asked ourselves the following: Do people typically create a copy of an existing report before editing it or vice versa? Will everyone understand the difference between "Save" and "Save As"? How loud does the email schedule need to be (if toggled "On") relative to other functionality on the page?
Results
By releasing this in beta initially, we were able to collect feedback and prioritize what to fix or build next that would be of high value to customers. Some of the top feedback we addressed included: wanting to hide rows without data to make the table easier to digest, more filtering capabilities, speeding up the loading times. It was also rewarding to hear recruiters feeling empowered to build the report they need to better frame their meetings with hiring managers, ultimately making their time more productive. When reflecting on our process, the impact that research had on the design direction was a huge win as it saved users a lot of confusion and engineering time as a result.